Employee wellbeing. Yva.ai methodology
Employees can feel wellbeing differently at different stages. It is often impossible to unambiguously determine the level of well-being or burnout by the look of the employee. There are tests for self-assessment of stress and burnout, but they have serious drawbacks.
It is difficult to scale the test for the entire company – the results will be too subjective. In addition, it will be difficult for employees to pass it regularly.
To solve the problem of determining the level of employee well-being, Yva relies on more objective passive analytics - the analysis of employee behaviour in corporate communication sources, such as email and corporate messengers.
The Yva.ai neural network measures 17 parameters in real-time and retrospectively and evaluates employee behaviour patterns based on them.
Yva.ai wellbeing index
Yva.ai wellbeing index is a result of analysis of the employee’s historical communication data. If there is no access to historical data, for example, an employee has just started working in the company, then the model will need some time to understand how the employee behaves normally. On the graph, you will see whether the system has enough data to build an accurate graph.
The platform can determine the current state of an employee by analyzing historical data. If there is no access to historical data, for example, an employee has just started working in the company, then the platform will need some time to understand how the employee behaves normally. On the graph, you will see whether there is enough data available to build an accurate graph.
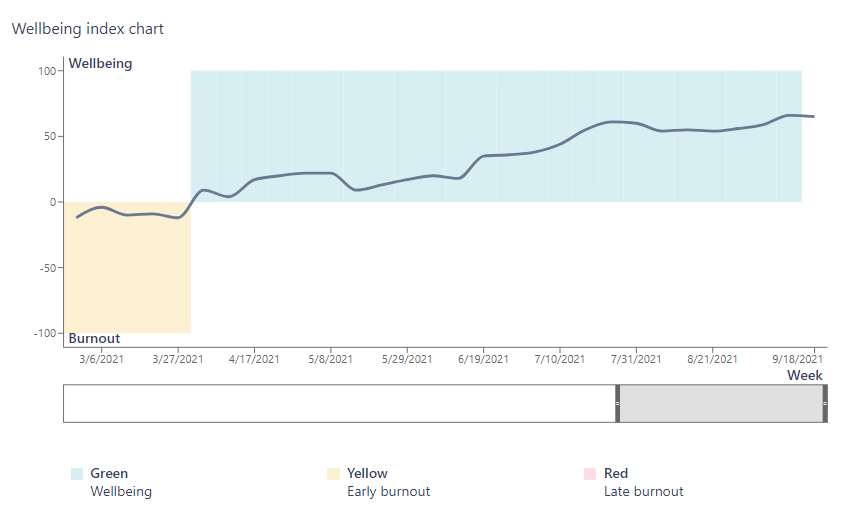
How to read the Yva.ai wellbeing index graph
It is important to clarify that the values of the well-being index are not the probability of dismissal. This is his state of well-being or burnout.
It is recommended to look not at a specific index value at any given time but at its distance from 0 on the well-being scale and its dynamics.
If you see a decrease in the well-being index, it means that Yva.ai has seen in the employee the activity traits inherent in employees with early or late burnout.
An increase in the index means an improvement in the well-being of employees.
In general, if the YWI is above zero, the employee feels good. If it is below zero — it is worth worrying and taking corrective actions to return his well-being to the proper level.
When analyzing the schedules of your employees, consider the “Data Sufficiency " metric. If the metric value is "Good”, it means that the amount of digital activity of the employee is sufficient to determine the zone of well-being. If it is "Poor”, it means that the employee's digital activity is not enough for the model to work correctly.