Yva.ai dashboards
Using Yva.ai each employee will get the information they need on engagement and informal leadership, depending on their role in the company.
Dashboards for the top management or HR professionals
If you are an executive or an HR professional, you are interested in a “big picture” before you go to the details.
Corporate health heatmap
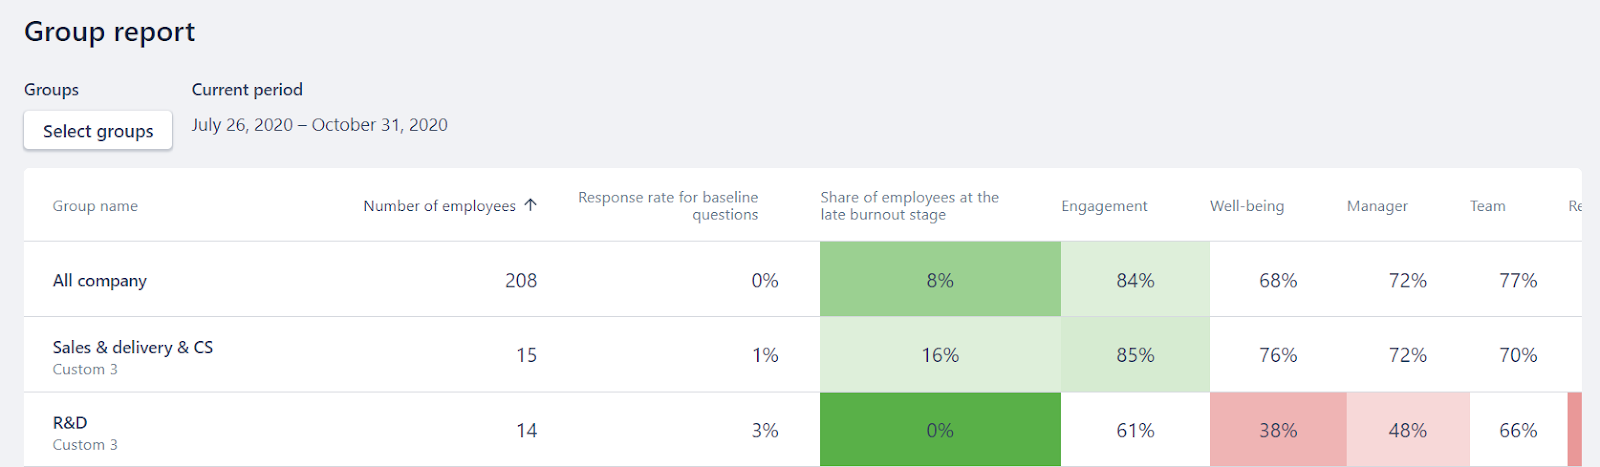
The Group report is the place where you see your corporate heat map.
Each line represents your group or department.
Each column represents one of the most important employee experience metrics.
Green cells indicate a positive situation.
However, if you see a red cell, it is a signal that something is going wrong.
The number in the cell represents the number of positive answers provided by the employees in this group regarding the particular driver or aspect.
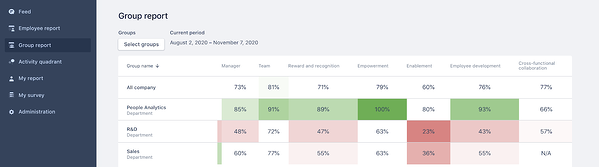
For example, The picture above reads that there is a problem in the R&D department especially regarding the Enablement driver as it has only 23% of positive answers. To learn more about the situation, you can click on the red cell and you will see the new screen:
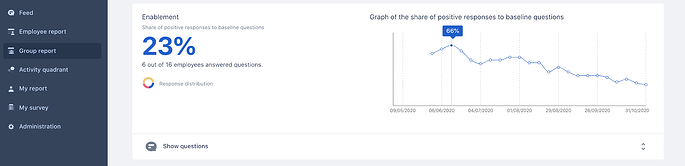
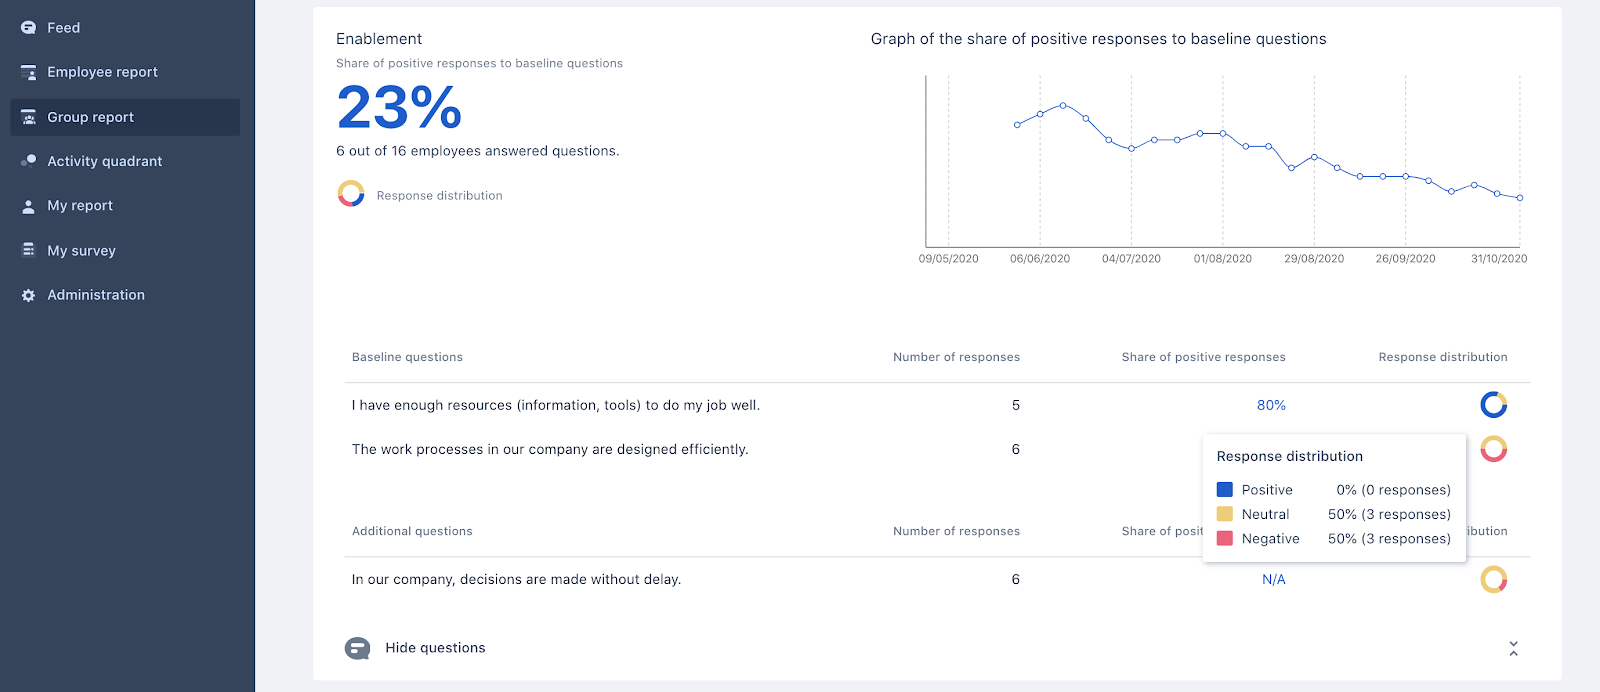
You see that the Enablement metrics was not so bad in the middle of June, it was 66%. However, it went down to 23% now. If you want to know more like what exactly bothers your R&D employees, click the “Show Questions” button and you will see 0 positive responses to the two questions out of three questions comprising the Enablement driver:
“The work processes in our company are designed efficiently” (3 neutral and 3 negative answers)
“In our company, decisions are made without delay” (5 neutral and 1 negative answer)
You will be able to see that it was not one accidental “bad mood” situation. From June to October for 4 months the co-worker’s answers were constantly declining. If you choose to not wait for any more, you would decide
to collect all R&D departments to the all-hands meeting and ask openly what do we need to change to improve
come up with the list of corrective actions
implement and observe improvements
Employee engagement, wellbeing, and satisfaction
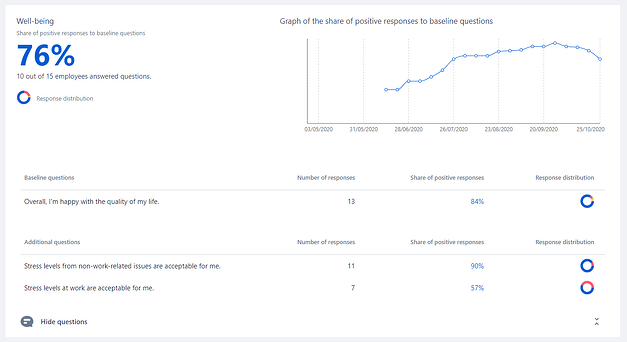
The Group report contains information about metrics such as Employee engagement (EE), wellbeing (EW), and satisfaction (ES) that are important to the HR service.
The screen shows information for each division of the company, demographic and geographical sections. After selecting a section of interest, the user can see detailed information about it by clicking on its name.
In Yva.ai, we distinguish engagement and wellbeing as separate indicators, when satisfaction is counted based on 11 drivers. The screen contains information about the indicator value, a graph of the percentage of positive responses, and the distribution of responses to basic and additional questions.
The list of departments can be found in the report by the group, where the user can view the necessary information for each division of the company, demographic and geographical sections. This tool allows the user to see the difference in wellbeing, for example, by gender or work experience.
Company and departments wellbeing
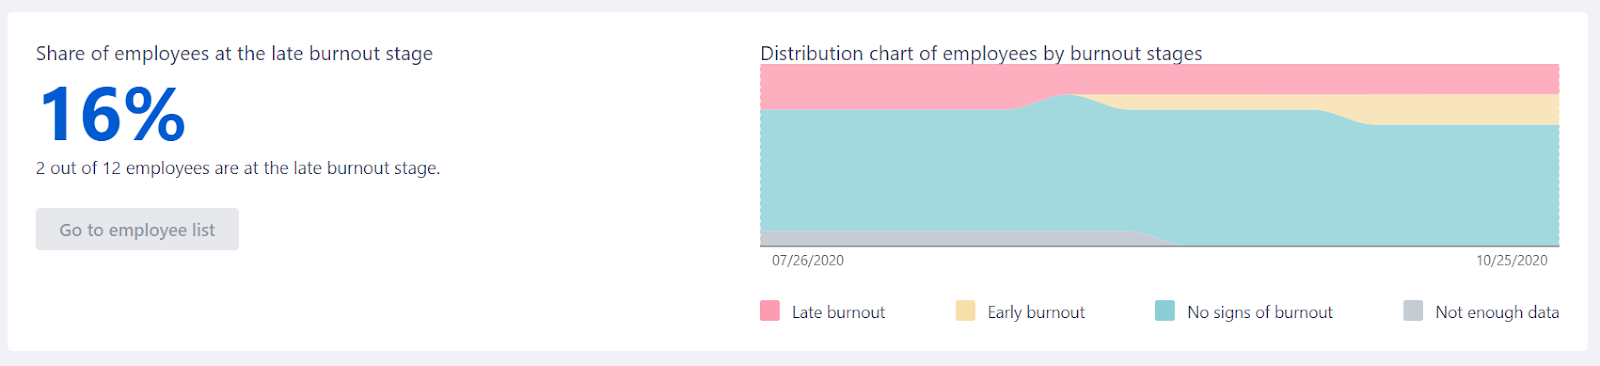
One important piece of information to be viewed by senior management and HR professionals is a list of the most burned-out departments/employees and the distribution of employees by wellbeing stages.
The list of groups can be found in the Group report, where managers can view the necessary information for each division and the entire company. The user can sort the data by any indicator in the panel.
After identifying the group of interest, the manager can get detailed information about this group by clicking on its name. This screen shows the distribution of employees by wellbeing stage.
Potential problems
The user can see potential problems in the selected group’s screen in the Comparative employee groups analysis. The screen below shows the results of the survey based on wellbeing.
This screen is available for each of the 11 Employee satisfaction (ES) drivers analyzed. The distribution of answers to basic questions will help the manager understand what is bothering or demotivating employees in this group, as well as help them to understand the period of deterioration or improvement of a particular driver.
Individual employee wellbeing
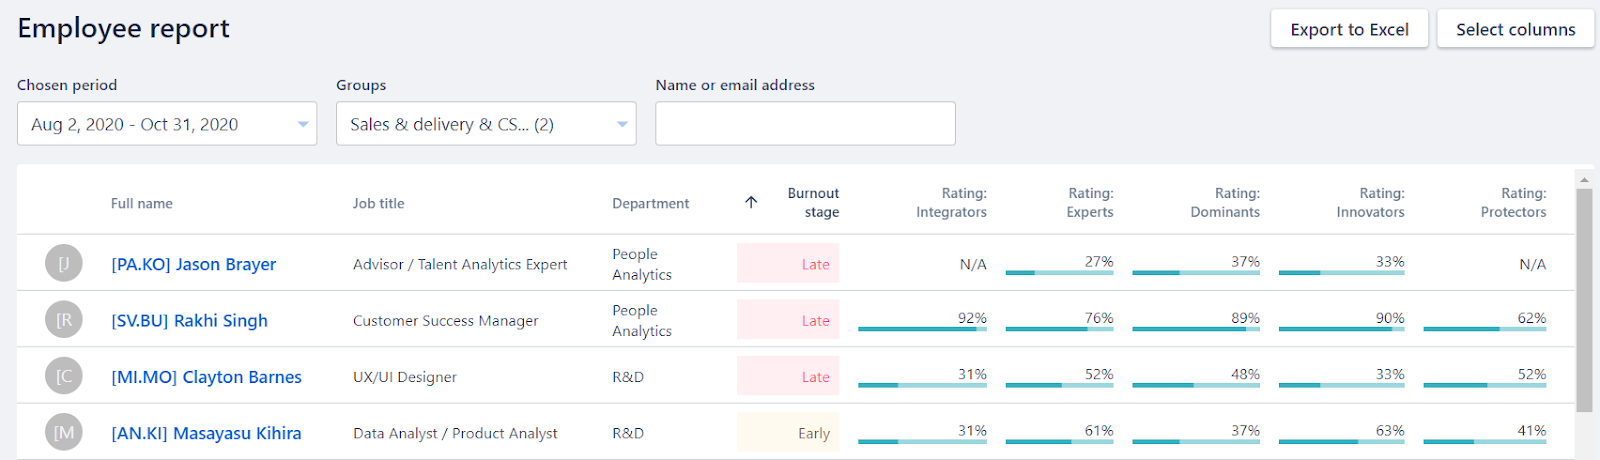
The list of employees can be found in the Employee report, where the employee can view the burnout for the company as a whole, and in the context of the required division or group. The user can sort by any indicator displayed on the dashboard.

A wellbeing chart is available for each employee.
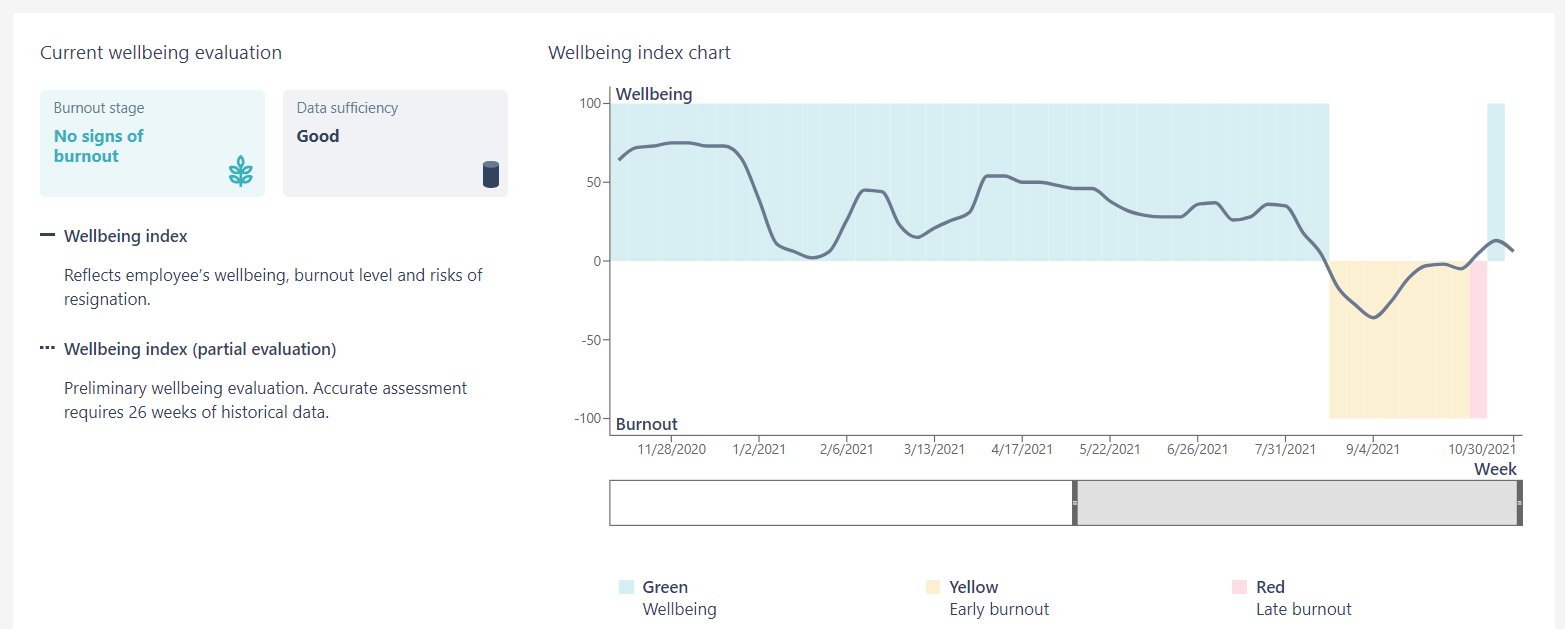
After evaluating the wellbeing of a specific employee, the user can go to the Group report to perform the group wellbeing assessment.
Informal leadership
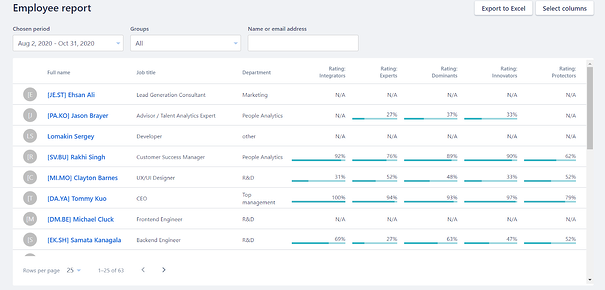
The user can evaluate the leadership qualities of individual employees in the Employee report. Yva.ai highlights 5 leadership styles.
Employees evaluate the level of each type of leadership and the existence of relevant skills among colleagues, as well as provide open comments and recommendations. This information will be useful for the HR Department in conducting face-to-face meetings on the employee's PDP (Personal Development Plan), and in identifying informal leaders in the organization who can influence the opinion of other employees.
Dashboards for managers
Employee wellbeing in their department
The list of employees can be found in the Employee report, where the user can view the wellbeing of their division. The user can sort by any indicator displayed on the dashboard.
A wellbeing chart is available for each employee.
Informal leadership
The user can evaluate the leadership qualities of individual employees in the Employee report. Yva.ai highlights 5 leadership styles.
Employees evaluate the level of each type of leadership and the existence of relevant skills among colleagues, as well as provide open comments and recommendations.
Employee's Collaboration analytics
Yva.ai allows the manager to see the most and least conflicting employees in the team from their Collaboration analysis and prevent potential conflicts in the team or with clients.
This information can be found in the Employee report.
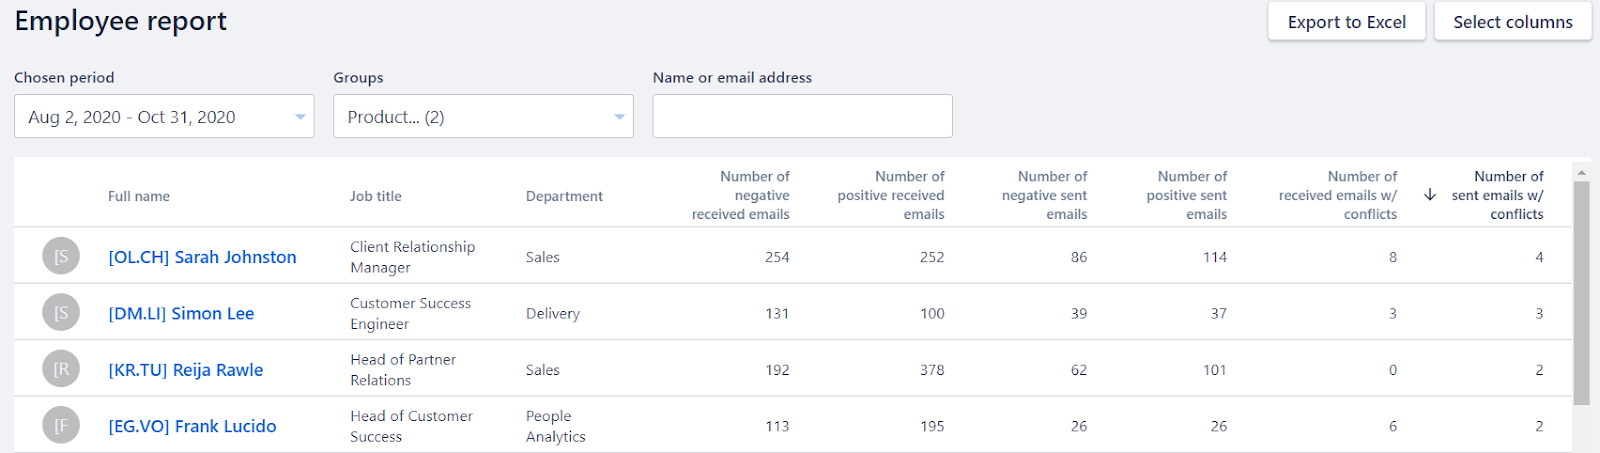
In addition to these columns, the manager can view the semantic analysis for messages with tasks or messages from external or internal recipients.
Dashboards for employees
A user who is a line employee gets the following features when using Yva.ai.
Evaluating colleagues and peer-to-peer feedback
Through Smart micro-surveys, Yva.ai allows an employee to anonymously evaluate colleagues with whom the employee communicates closely. It helps the platform to identify who and about whom to send survey questions.
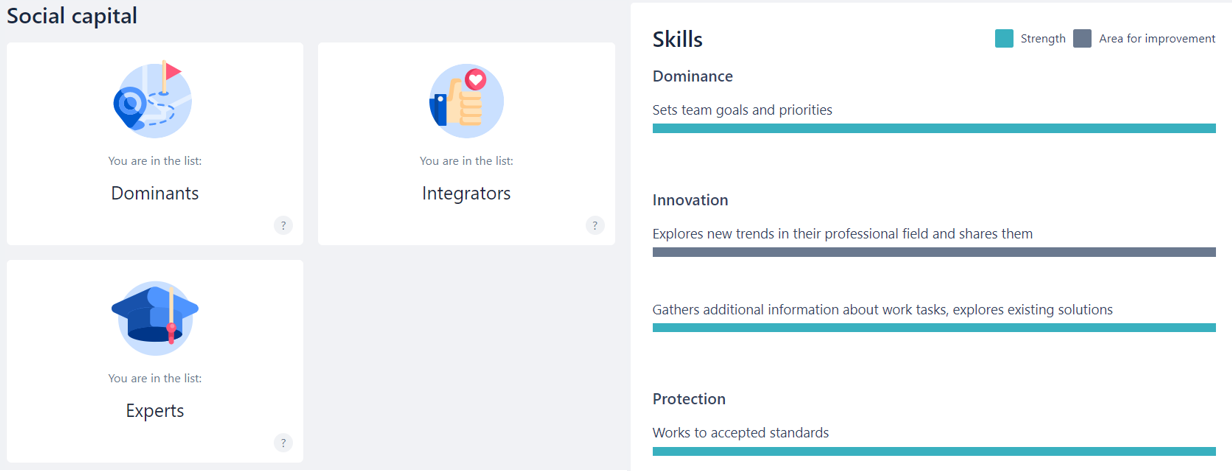
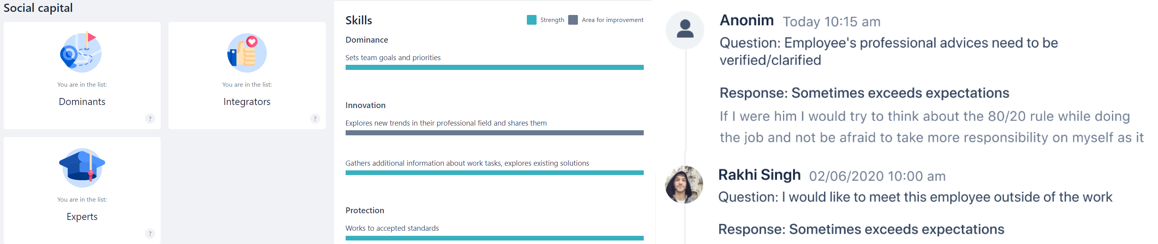
An employee can also view the opinion of their colleagues about themselves. This can be done in My report via the Social capital tab.
Through this tab, the employee can see how colleagues evaluate their expression of each leadership style and skills within each leadership style. The more colleagues consider them leaders in a particular field, the more social capital they have. There is also a section where the user sees feedback from colleagues.
The user can see their strengths and weaknesses and mark what is worth working on in the future.
Evaluating the wellbeing
In the wellbeing assessment tab, the user can see their wellbeing diagram, which allows understanding of when the decline in activity began and pessimism began to accumulate. This will lead to the start of self-reflection towards positive changes.
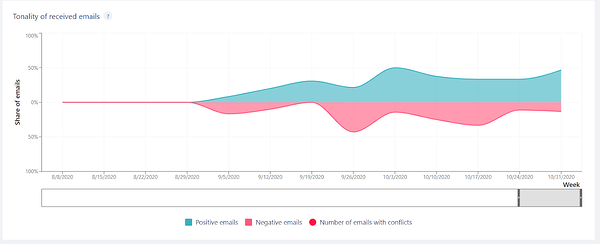
Collaboration analytics
Yva.ai allows an employee to see semantic analysis of their incoming and outgoing emails, as well as the presence of conflicts and other metrics that go about in their Digital workday. This information can be a starting point for evaluating the wellbeing and working on feedback from colleagues.
The Collaboration analysis is located in the following tabs of My report:

The information is arranged in convenient graphs with a configurable width of the date axis. Some of the graphs also show information about the company, so that the users could compare themselves with colleagues.