Performance evaluation
The platform can help the company and employees evaluate each other's performance.
In Smart surveys, there are two questions about the performance of employees.
The platform sets two: open and closed. This allows the employee and his manager to monitor the performance of their work every week.
Give colleague feedback on their performance over the past few weeks (5 possible answers: from Significantly above expectations to Significantly below expectations)
Give a comment here: what went well? What could have been done better?
The performance is evaluated based on feedback from colleagues with whom a person cooperates. This allows you to judge the work of an employee in a versatile and unbiased way.
The platform appoints whom the employee evaluates based on his circles of cooperation – these are the people with whom the employee solves work tasks together, as well as colleagues from his department.
The same employee is offered to the user for evaluation no more than once every five weeks. If an employee finds it difficult to characterize the work of a colleague, he can click the Can’t say, we didn’t collaborate enough button.
The platform calculates the Performance score metric for each employee for whom there were at least 3 responses in the last 13 weeks.
To calculate it, the platform uses the arithmetic mean of all the responses for this employee for the period divides it by 4 and multiplies it by 100. The responses are graded as follows:
Significantly below expectations = 0
Below expectations = 1
Met expectations = 2
Above expectations = 3
Significantly above expectations = 4
Can’t say, we didn’t collaborate enough - it is not taken into account when calculating the metric, it does not reduce it.
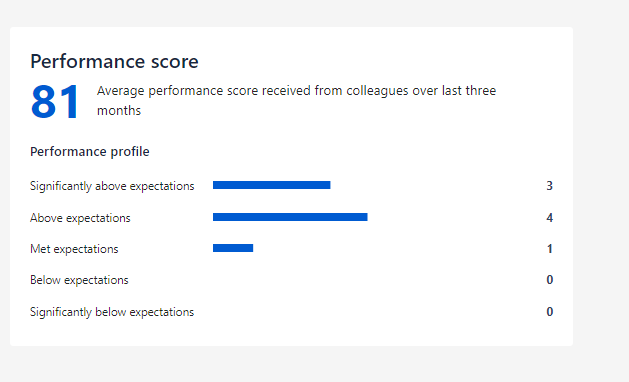
Thus, you should not be afraid when you see a performance score of 80, not 100. This is a fairly good result. For a more complete understanding of the situation with your performance, according to colleagues, it will also be useful to consider the rating profile in your personal report, which will show the number of responses for each of the options from Significantly above expectations to Significantly below expectations
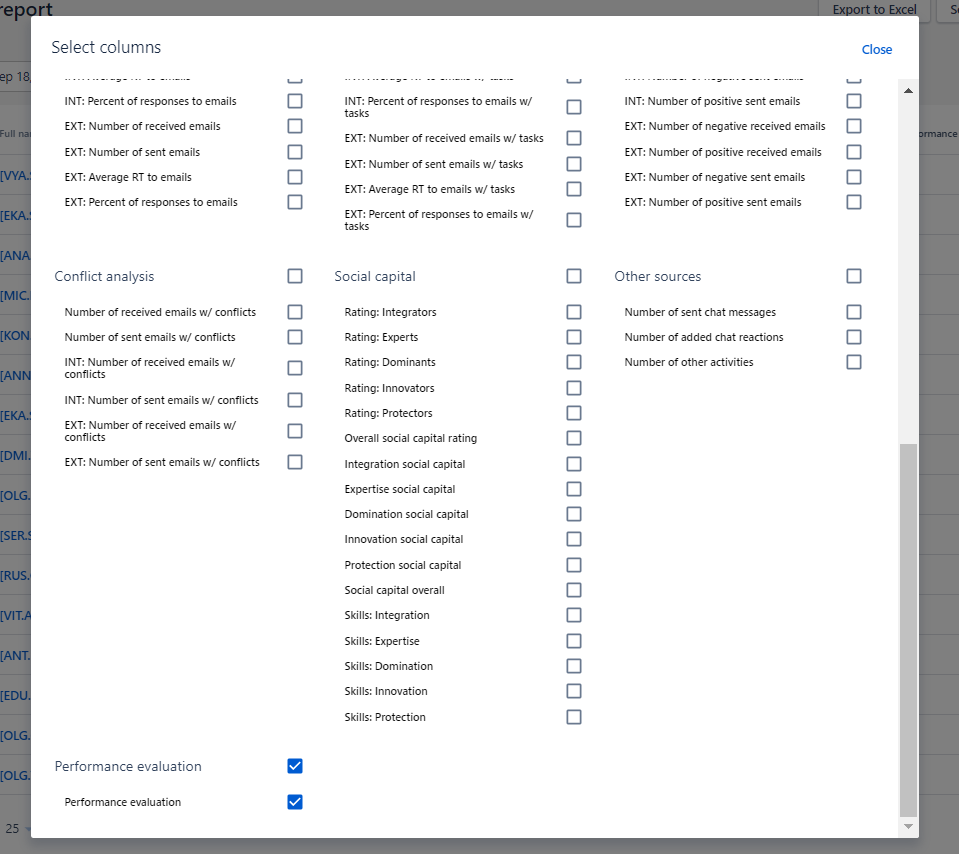
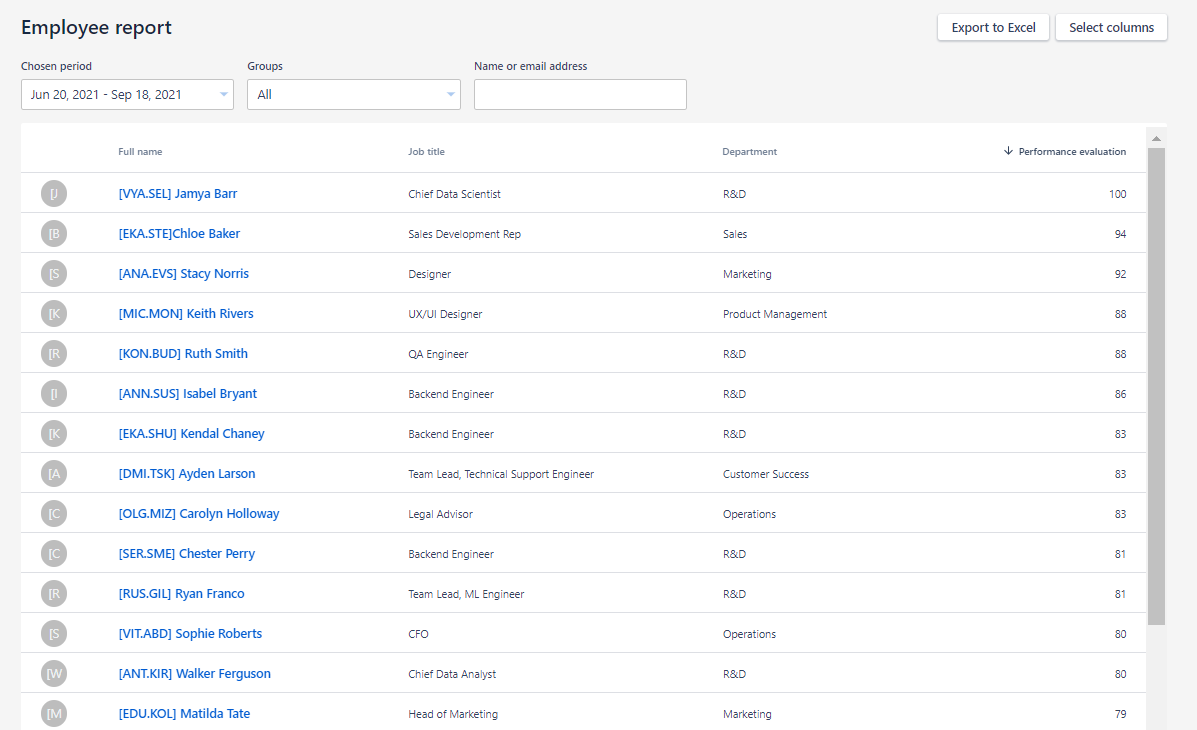
You can find metrics in the Employee report or the My report.
Employee report
My report