Employee experience. Results interpretation
Group report
The results of the engagement study in the platform can be found in the “Group report” section.
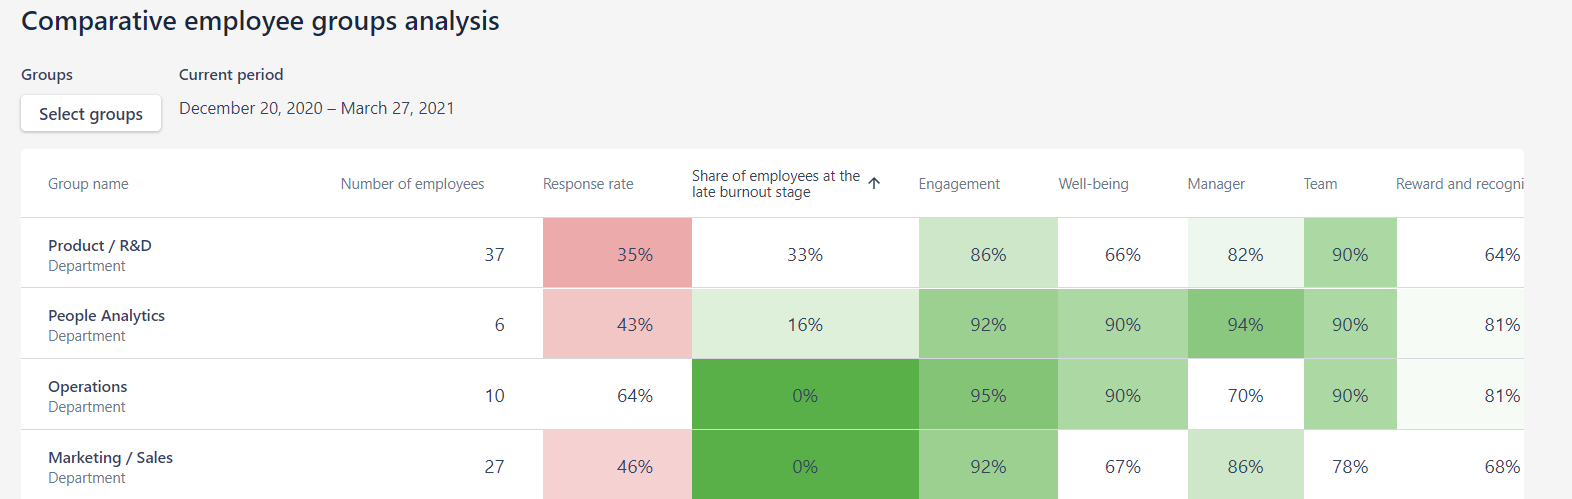
The lines in it represent employee groups, for example, selected departments. Columns possess metrics:
engagement,
employee well-being,
manager,
team, etc.
Cells in the table are colored according to the "heat map” principle: cells where the results are high are green, where the results are low - red.
The percentage in each cell shows the percentage of positive responses received from employees when assessing a particular work aspect. For example, 87% engagement means that 87% of employees had an average score of 7 or more (out of 10) on 3 engagement-related questions.
If you see N/A in the cell, that means the platform hasn't received enough answers for the group. To keep the respondents' answers confidential, at least 5 people from the group must answer the questions so that their results can be displayed.
Results are shown for the last 13 weeks (full survey cycle) and are updated with each weekly employees' survey cycle.
The platform allows you to select groups for comparison and groups for intersection. The groups for comparison are shown in the screenshot below. By default, the platform displays results for all departments, but using the "Select groups” menu, you can select those groups, statistics for which you are currently interested in. Groups for intersection allow you to display any second parameter for comparison within groups. For example, the results of employees with different length of employment period within the department.
Detailed results
By clicking on the group name, or on any opposite cell, you will go to the detailed report on the group.
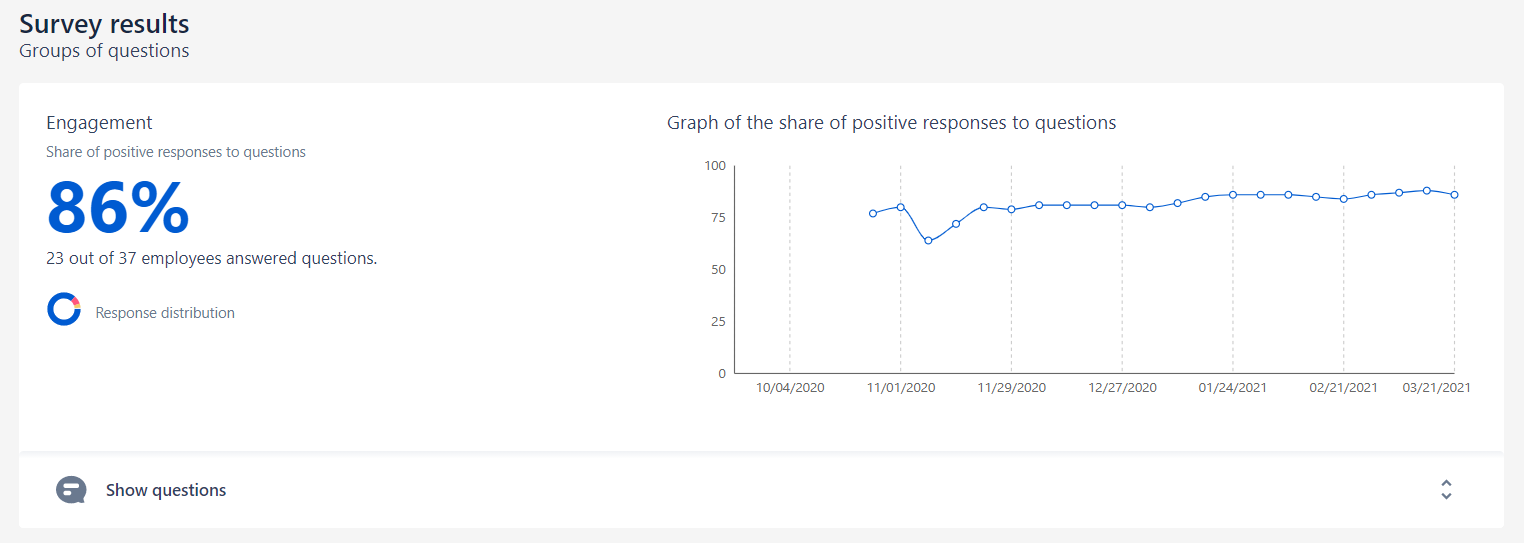
Positive responses share diagram shows the response dynamics. Each number means an aggregated result over the previous 13 weeks by engagement, employee well-being, or drivers.
If the response dynamics is falling, it is a signal that employees are likely to experience discomfort or decreased motivation. If the dynamics is rising, it is a good sign. It is important to track the events, which make the dynamics rise and fall in order to manage employee engagement.
Results based on questions
Using the "Show questions” menu, you can open detailed results to the questions:
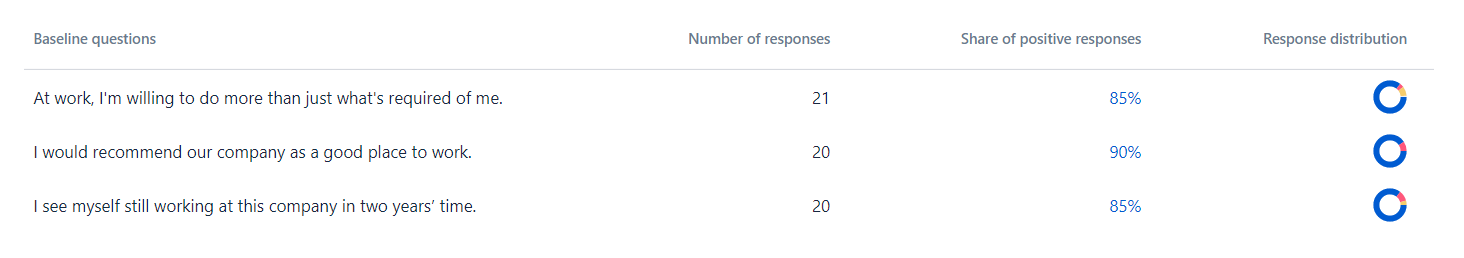
Positive response rate is the percentage of employees, who answered 7, 8, 9, or 10 (ranging from "agree” to "strongly agree”) to questions.
You can see which points in your organization are assessed in the most positive way. Have a look at the "bottlenecks” in different departments, and draw up targeted corrective actions.
Once the results have been analyzed, it is recommended to focus on not more than three aspects that you will be dealing with.